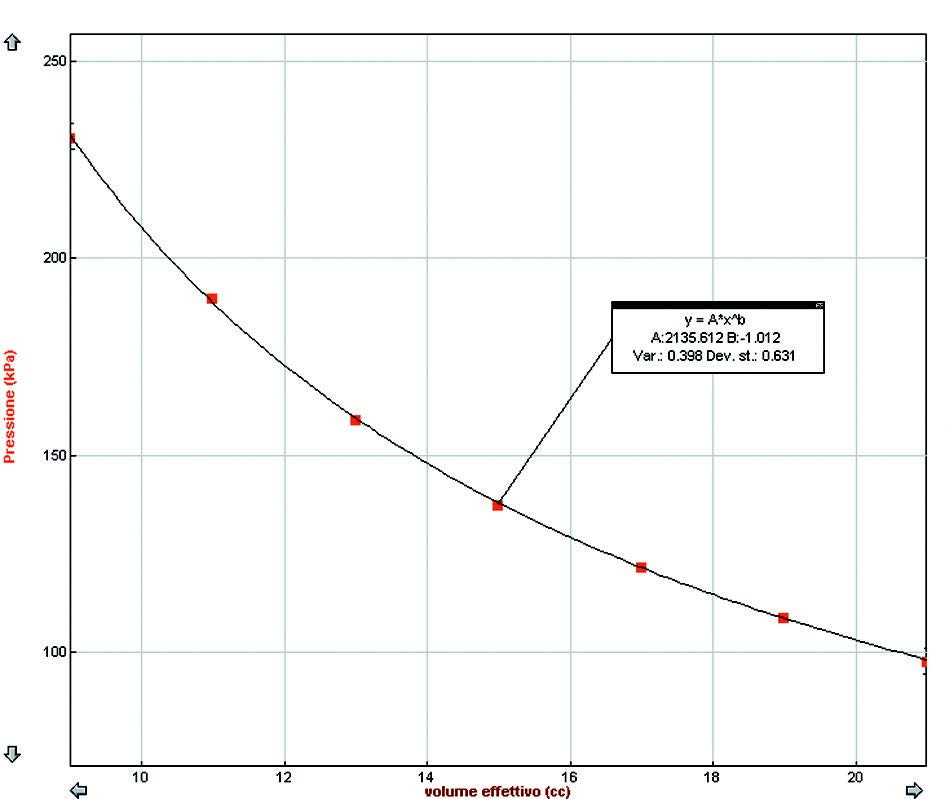
Pressure graph according to volume, obtained point by point
thanks to data acquisition system based on a PC.
The interpolating curve approximates with precision
the equation p V = cost.
Thanks to this item it is possible to study quantitatively the isothermal conversions of gases. A transparent graduated cylinder is linked to a pressure sensor through a dual tap. Acting on the control knob the piston moves varying the volume of the air contained in the cylinder. Connecting the sensor to a real time data acquisition system it is possible to obtain the pressure Vs volume chart at a constant temperature. Supplied with teaching guide.
Related Literature:
![]() ScienceCube - Software & Driver - 60.22 MB
ScienceCube - Software & Driver - 60.22 MB

Pressure graph according to volume, obtained point by point
thanks to data acquisition system based on a PC.
The interpolating curve approximates with precision
the equation p V = cost.